


By Dan Ross
Over the years, the rise of the so-called super trainer has prompted many a clutched pearl by virtue of a perceived monopoly on the sport.
Anecdotally, it can certainly appear as though the same few names wield an outsized impact. But what does the data say?
The TDN has crunched the numbers in California from 2007 onward. This is far from a comprehensive overview of the situation, and what emerges is a picture that can be viewed from multiple angles.
On the one hand, the numbers suggest that the biggest stables in the state have indeed consolidated their positions at the top during a long period of market contraction. Yet at the same time, other indicators afford tentative encouragement for the smaller players.
One statistic that should make industry leaders sit up and take notice, however, is how in just 14 years, the number of trainers making at least one start in California has nearly halved. As a market shrinks, the impact from any dominant force is going to be more keenly felt.
Super trainers
One common narrative in California is that the 80/20 rule–the notion that 80% of prize money funnels into the pockets of 20% of the trainers–has long been a defining feature of the industry.
How accurate is this?
The 80/20 rule has fluctuated a little over the last 14 years, with the top 20% of trainers in the state typically winning more then 80% of available purses. Indeed, back in 2007, they won more than 85% of all available prize money.
Between 2007 and 2018, the closest California came to the 80/20 benchmark was 2015, when the top 20% trainers won 80.7% of all prize money. But the last two years have seen a very slight shift in that trend.
In 2019, the top 20% of trainers won 80.8% of prize money. Last year, it fell to 79.2%–the first time it dipped below 80% in at least 14 years.
There doesn't appear any one clear explanation. These past two years in California have been far from typical, with 2019's welfare issues followed by a global pandemic. It's unclear, however, exactly why those events should begin to iron out prize money distribution disparities.
Another factor to take into consideration is purse distribution between stakes and overnight races. Then there's the shrinking opportunities out West–has that led to the bigger barns stabling more horses elsewhere?
Arguably more consequential was the expulsion in June of 2019 of trainer Jerry Hollendorfer from The Stronach Group's California facilities (Santa Anita and Golden Gate Fields).
Prior to that, Hollendorfer had been the dominant numerical force in California racing for many years. In 2018, for example, his runners made up 3.6% of all starts in the state. As recently as 2015, they had made up 4.1% of all starts in the state.
Nevertheless, without a clear understanding of where Hollendorfer's horses went, it's difficult to accurately diagnose. And as we shall see farther down, when the data is restricted to stables with 100+ horses making a start per year, their dominance appears as strong as ever.
Trainer data
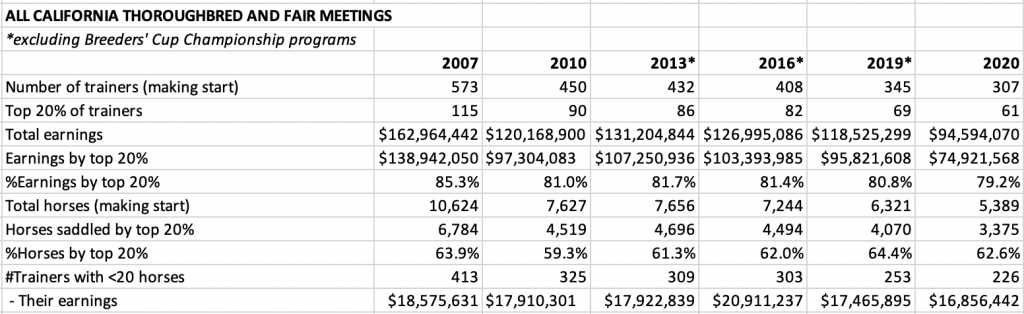
Between 2007 and 2020, California has witnessed a 46.4% decrease in the number of individual trainers making at least one start: from 573 in 2007 to 307 in 2020.
At the same time, the number of trainers making up the 20% highest earners has decreased by nearly 47%–from 115 in 2007 to 61 last year–putting it in line with the overall drop in trainers.
The top 20% of trainers have consistently had an outsized impact when it comes to the apportioning of horses.
For the past 14 years, these top 20% trainers have started between 58.6% and nearly 65% of horses that have made at least one start in the state.
There are other indicators illustrating how, while the industry has shrunk, the big players have consolidated their position at the top.
One hundred-plus horses
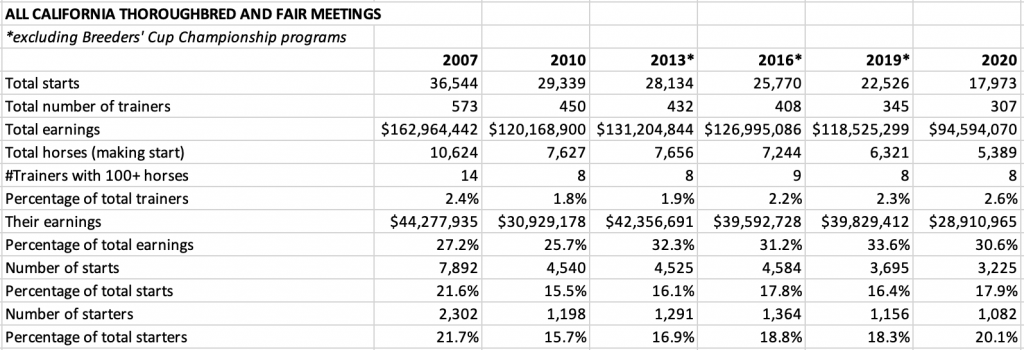
Back in 2007, the number of trainers with 100 or more horses making at least one start per year was 14–the highest over the last 14 years.
Since then, however, the number of trainers with 100 or more horses making at least one start has fluctuated between eight and 12.
This means that while the number of active trainers in California has almost halved, the number of trainers with 100+ horses making starts has stayed fairly constant.
Not surprisingly, these large stables have long wielded tremendous sway in terms of prize money won and number of starts made.
In 2007, the 14 stables with 100 or more horses making at least one start annexed roughly 27% of all prize money and 21.6% of all starts. These 14 stables represent 2.4% of all trainers with at least one start in the state.
In 2020, the eight stables with 100 or more horses making at least one start (Isidro, Glatt, Sadler, Wong, O'Neill, Baltas, Miller and Baffert) represented 2.6% of all trainers with at least one start in the state. All in all, they annexed nearly 31% of all prize money and roughly 18% of all starts.
Lower end
There are, however, some angles to the data which appear to show glimmers of encouragement for the smaller stables barely scratching out a living.
As the number of active trainers in California has shrunk, the average earnings per trainer have trended upward.
Comparing 2007 to 2020, the average earnings per trainer for the bottom 80% had increased nearly 53% (from roughly $52,000 in 2007 to roughly $80,000 last year).
In comparison, the average earnings per trainer for the top 20% had increased only 0.6% during that same period (from roughly $1.212 million in 2007 to roughly $1.220 million last year).
Comparing 2007 figures to last year's, the bottom 80% of trainers have also significantly outpaced their top 20% cousins in terms of growth in both earnings per horse and earnings per starter.
Nevertheless, when the data is adjusted for the relative purchasing power of the dollar, the picture looks less rosy. When overall earnings per trainer are adjusted for inflation, for example, we see a more than 13% decrease from 2007 to last year.
To reinforce just how important the smaller stables are to the racing ecosystem, over 70% of trainers start fewer than 20 individual horses a year, but last year their horses accounted for about one-quarter of the entire horse inventory (1,392 of 5,389) and about one-quarter of all starts (4,321 of 17,973).
If the health of a racing product is defined in good part by fielding races with a varied breadth of competitor, therefore, this certainly leaves much food for thought, especially when the broken business model widely used throughout the industry disproportionately impacts the smaller trainer struggling to stay afloat.
And if the smaller stables find themselves unable to survive in an increasingly lopsided marketplace, what kind of product can the bettor expect?
Note: The data is derived from Daily Racing Form chart text files.
Not a subscriber? Click here to sign up for the daily PDF or alerts.