
-
- Stallion Videos
- Sire Lists
-

-
Research
Features
Contact Us
Archive
Social
Careers
Real Estate
Ben's Stall
-
Remember Ben with a gift to Thoroughbred aftercare

-
-
Remember Ben with a gift to Thoroughbred aftercare
TDN Sales Statistics is a customized statistical tool to analyze sires' cumulative annual sales performance. All currencies are converted to US Dollars on the session date of the sale.
All sales reports may be run for individual stallions, or by sales type or year.
Short yearlings in January and February are reported with weanlings from the prior fall mixed season (and not with yearlings later in the summer in true yearling sales), as are mares in foal in January and February sales. Only two-year-olds in two-year-old-in-training sales are reported in the 2YO sales type.
|
2024 |
||||||||
|---|---|---|---|---|---|---|---|---|
| 2024 Weanlings There is no information available for this particular TDN Sales Statistics report. | ||||||||
| 2024 Yearlings There is no information available for this particular TDN Sales Statistics report. | ||||||||
| 2024 2-Year-Olds in Training Sales Statistics | ||||||||
| Fyr | Location | Stud Fee | Through Ring | Number Sold | Average (Rank) | Median (Rank) | Top Colt | Top Filly |
| 2021 | KY | 35,000 | 16 | 14 | $152,428 (44) | $87,500 (61) | $350,000 | $430,000 |
| 2024 Covering Sire There is no information available for this particular TDN Sales Statistics report. | ||||||||
|
2023 |
||||||||
|---|---|---|---|---|---|---|---|---|
| 2023 Weanlings Sales Statistics | ||||||||
| Fyr | Location | Stud Fee | Through Ring | Number Sold | Average (Rank) | Median (Rank) | Top Colt | Top Filly |
| 2021 | KY | 30,000 | 41 | 31 | $74,467 (102) | $60,000 (102) | $260,000 | $190,000 |
| 2023 Yearlings Sales Statistics | ||||||||
|---|---|---|---|---|---|---|---|---|
| Fyr | Location | Stud Fee | Through Ring | Number Sold | Average (Rank) | Median (Rank) | Top Colt | Top Filly |
| 2021 | KY | 35,000 | 116 | 95 | $156,508 (56) | $105,000 (57) | $950,000 | $750,000 |
| 2023 2-Year-Olds in Training Sales Statistics | ||||||||
|---|---|---|---|---|---|---|---|---|
| Fyr | Location | Stud Fee | Through Ring | Number Sold | Average (Rank) | Median (Rank) | Top Colt | Top Filly |
| 2021 | KY | 45,000 | 44 | 37 | $189,797 (21) | $110,000 (38) | $650,000 | $700,000 |
| 2023 Covering Sires Sales Statistics | ||||||||
|---|---|---|---|---|---|---|---|---|
| Fyr | Location | Stud Fee | Through Ring | Number Sold | Average (Rank) | Median (Rank) | Top Mare | |
| 2021 | KY | 30,000 | 30 | 19 | $66,921 (77) | $50,000 (83) | $310,000 | |
|
2022 |
||||||||
|---|---|---|---|---|---|---|---|---|
| 2022 Weanlings Sales Statistics | ||||||||
| Fyr | Location | Stud Fee | Through Ring | Number Sold | Average (Rank) | Median (Rank) | Top Colt | Top Filly |
| 2021 | KY | 35,000 | 30 | 19 | $71,421 (107) | $77,000 (88) | $130,000 | $110,000 |
| 2022 Yearlings Sales Statistics | ||||||||
|---|---|---|---|---|---|---|---|---|
| Fyr | Location | Stud Fee | Through Ring | Number Sold | Average (Rank) | Median (Rank) | Top Colt | Top Filly |
| 2021 | KY | 45,000 | 105 | 81 | $201,689 (59) | $160,000 (60) | $900,000 | $500,000 |
| 2022 2 Year Olds There is no information available for this particular TDN Sales Statistics report. | ||||||||
| 2022 Covering Sires Sales Statistics | ||||||||
| Fyr | Location | Stud Fee | Through Ring | Number Sold | Average (Rank) | Median (Rank) | Top Mare | |
| 2021 | KY | 30,000 | 36 | 28 | $74,517 (75) | $60,000 (70) | $350,000 | |
|
2021 |
||||||||
|---|---|---|---|---|---|---|---|---|
| 2021 Weanlings Sales Statistics | ||||||||
| Fyr | Location | Stud Fee | Through Ring | Number Sold | Average (Rank) | Median (Rank) | Top Colt | Top Filly |
| 2021 | KY | 45,000 | 24 | 19 | $112,736 (73) | $95,000 (77) | $300,000 | $220,000 |
| 2021 Yearlings There is no information available for this particular TDN Sales Statistics report. | ||||||||
| 2021 2 Year Olds There is no information available for this particular TDN Sales Statistics report. | ||||||||
| 2021 Covering Sires Sales Statistics | ||||||||
| Fyr | Location | Stud Fee | Through Ring | Number Sold | Average (Rank) | Median (Rank) | Top Mare | |
| 2021 | KY | 35,000 | 27 | 25 | $112,180 (58) | $100,000 (44) | $375,000 | |
|
2020 |
||||||||
|---|---|---|---|---|---|---|---|---|
| 2020 Weanlings There is no information available for this particular TDN Sales Statistics report. | ||||||||
| 2020 Yearlings There is no information available for this particular TDN Sales Statistics report. | ||||||||
| 2020 2 Year Olds There is no information available for this particular TDN Sales Statistics report. | ||||||||
| 2020 Covering Sires Sales Statistics | ||||||||
| Fyr | Location | Stud Fee | Through Ring | Number Sold | Average (Rank) | Median (Rank) | Top Mare | |
| 2021 | KY | 45,000 | 26 | 21 | $157,476 (32) | $150,000 (26) | $400,000 | |
Never miss another story from the TDN
Click Here to sign up for a free subscription.

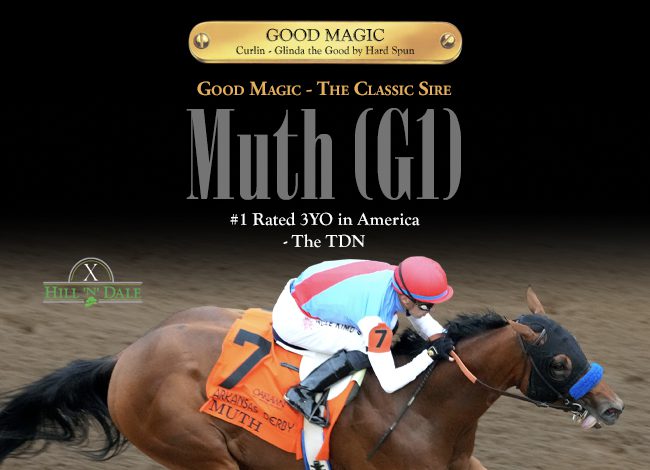 Good Magic