


By Dean Towers
While some tracks struggle, others surge. How does your track fit into the new racing landscape?
At the end of every month when Equibase releases the monthly Thoroughbred racing handle figures (along with the running yearly statistics) we see headlines that things were up, stagnant, or down. Sometimes these numbers elicit quite a bit of positive chatter, or consternation, depending on the trend.
The May numbers, for example, are published to the right.
There was no need to be alarmed with the 4% drop in May 2016 wagering, of course. Last month had one fewer Saturday (a huge handle day for horse racing) than May of 2015, and Kentucky Derby betting was down a little, which skews things dramatically.
As with most statistics, sure they tell a story, but it's sometimes not the right, or the whole story.
What the 2016 gross handle numbers illustrate, is wagering volume has been growing (up 2.09%) while race days are falling (by 6.33%). Some commentators believe this to be a very promising result because more money is being bet on fewer races; the upshot of which is that if there were more races, handle would be up even more. Whether that's true or not, the narrative in horse racing is, and remains, things are picking up a little.
Not ever being one to accept numbers as gospel, I set aside some time and took a deep dive into a trusty database of historical handle data, track by track, supplied by a friend. I'll share a little bit of what I uncovered.
Where is the 'growth' coming from?
 First, I standardized the data as best I could by eliminating outliers like Derby and Belmont Day, and adjusting for race date changes, like the shift in dates from Santa Anita to Los Alamitos. Then I placed tracks into groups: High handle, like Gulfstream and Belmont' $100 million to $200 million in handle tracks like Woodbine and Oaklawn; smaller venues of $50 million to $100 million in handle like Turf Paradise; down to the smallest handle venues like Fonner and Northlands.
I hoped this would lead to uncovering something worthwhile, and almost immediately I noticed some very interesting patterns.
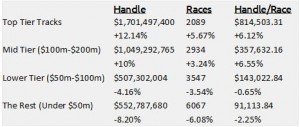
Gulfstream Park (through June 12th) ran 79 more races than they did in 2015, Aqueduct ran 34 more, Woodbine 35 more, Keeneland 11 more, Oaklawn 30 more. The top tier handle racetracks had an increase, not a decrease in races held, by 5.67%.
Seventy-nine more races at a place like Gulfstream translates to a possible eight more cards of racing at $8 million per card, so not surprisingly, gross handle from the top tier tracks grew by leaps and bounds–from $1.517 billion in the corresponding period in 2015 to $1.701 billion so far in 2016. That's an 13% increase.
Handle from the second tier grew from $953 million in 2015 to $1.049 billion in 2016, representing a 10% increase.
Yes, overall race dates in North America (and number of races) were down by about 5% as reported by Equibase, but races held were up, not down when it came to most of the racetracks with the highest handle.
Meanwhile, lower tier tracks (as a group) have struggled somewhat. And it is here that the industry is seeing the bulk of the race date reductions.
For tracks between $50 million and $100 million in gross 2016 handle, races held dropped from 3,677 in 2015 to 3,547 this year. Handle at these venues is down $22 million year over year to date.
For tracks who have handled between $30 million and $50 million so far in 2015, races were reduced by 316 year over year and handle is down by $38 million.
For micro-tracks with short meets, the number of races held is off by 77 races with handle down about $14 million.
I would be remiss not to note that even with more race dates at the bigger racetracks (helping to fuel their gross handle gains), many of these tracks are attracting more dollars per race, which is strongly indicative of bettor and customer interest. Handle per race at Gulfstream is up 8.60%, and Aqueduct was up 10.56%. They're doing something right, beyond holding more racing.
The major takeaway, I feel, is a simple one. Many in the industry have asked for fewer race dates for smaller tracks, and for larger signals to be more front and center (with the hopes that it makes for stronger overall customer demand). Whether the big track gains and smaller track losses have more to do with the mild East Coast winter and/or statistical noise remains to be seen, but right now this appears to be happening.
The Big Three in 2016
As of yesterday, Thoroughbred handle in North America for 2016 is up about $159 million. Handle at Aqueduct, Belmont and Gulfstream alone is up $220 million.
Last year at this point, the 'Big Three' made up about 30% of overall handle. In 2016, that number has jumped to almost 33%.
It's correct to say handle is up in Thoroughbred horse racing in 2016, but it's also correct to say that outside the 'Big Three', it's down.
The Mid-Atlantic Quagmire
Parx races have been reduced from 680 to 540, Monmouth is down from 149 to 132 for their ongoing summer meet, and both have had significant handle reductions. Penn National has had races held increase by 43, but handle is down. Delaware Park has seen reductions in races from 115 to 98 with a loss of handle of about $5.5 million.
Laurel has changed the landscape, with races held up from 292 to 466 compared to last year, along with a whopping increase in handle from $48.8 million to $110.5 million.
It looks like the Mid-Atlantic region racetracks need some time to sort themselves out.
Good News Notes
Mahoning Valley has begun to settle in, with a gross handle jump from approximately $34 million to $48 million, at a big 32% increase per race.
Woodbine bettors have seamlessly transitioned to the new Tapeta surface with strong gains. So far in 2016, handle is up to $107.6 million from $86.1 million on 22 more races.
Canterbury Park has had a rough start to the meet with weather, and had to card fewer races year over year, but the Shakopee, Minnesota racetrack's per-race handle is up 6% over 2016. As you may recall, Canterbury lowered takeout this meet to try and attract more dollars.
Conclusions
Despite takeout rates, field size, signal distribution, weather and countless other factors that contribute or take away from betting demand, it can be said that handle in 2016 has been trending in the right way. With the highest handle tracks showing gains and carding more races for horsemen, it appears it's been a net positive for horse racing in 2016 thus far.
For those who have wanted the stronger signals to take more market share in the cluttered simulcast racing landscape, you are no doubt pleased. Whether this trend continues, or will turn out to be only a statistical anomaly will probably be settled over the second half of the year.
Dean Towers is a board member of the Horseplayers Association of North America and has presented at several gambling conferences across North America. Dean has also authored a white paper on Exchange Wagering.
Not a subscriber? Click here to sign up for the daily PDF or alerts.